The United States has always been a nation built by immigrants. From the earliest settlers to today’s newest arrivals, immigrants have shaped American culture, strengthened the economy, and contributed to communities across the country.
Today, nearly one in seven people living in the United States was born in another country, making America the world’s top destination for immigrants.
This guide breaks down the key facts and statistics about immigration in America.
We’ll look at who immigrants are, where they come from, how they contribute to the economy, and what their presence means for the future of the United States.
Whether you’re a student, a policy maker, or simply someone interested in understanding immigration better, this guide will give you clear, straightforward information about this important topic.
The Big Picture: Immigration in America Today
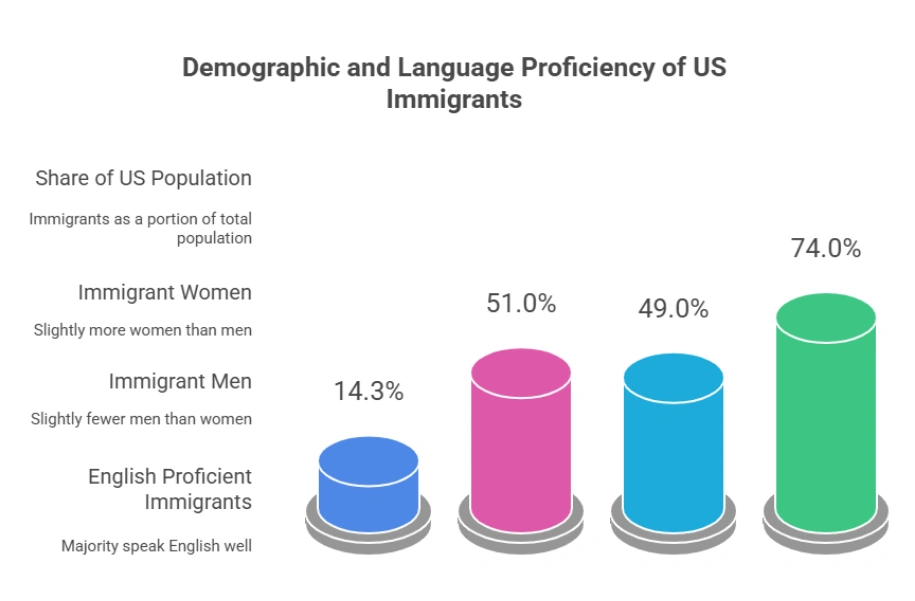
As of 2023, the United States is home to 47.8 million immigrants, representing 14.3% of the total population. To put this in perspective, that means about 1 in every 7 people you meet in America was born in another country.
Key Statistics at a Glance
| Measure | Number/Percentage |
| Total immigrant population | 47.8 million |
| Share of US population | 14.3% |
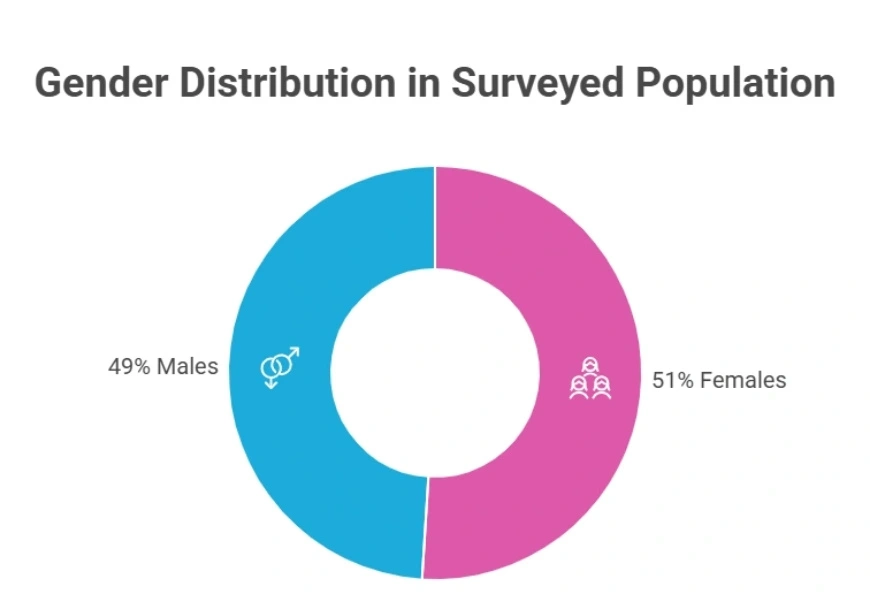
| Immigrants who are women | 51.0% |
| Immigrants who are men | 49.0% |
| Immigrants proficient in English | 74.0% |
Nearly half of all immigrants—49.5%—have become naturalized US citizens, meaning they’ve gone through the citizenship process and can vote in elections.
This shows that most immigrants aren’t just passing through—they’re here to stay and become full members of American society.
Where Do Immigrants Come From?
Immigrants in the United States come from all over the world, but five countries account for the largest numbers:
Top 5 Countries of Origin
- Mexico – 22.8% of all immigrants (about 10.9 million people)
- India – 6.1% of all immigrants (about 2.9 million people)
- China – 4.6% of all immigrants (about 2.2 million people)
- Philippines – 4.3% of all immigrants (about 2.1 million people)
- El Salvador – 3.1% of all immigrants (about 1.5 million people)
Mexico remains the largest source of immigrants to the United States by far, though immigration from Asian countries like India and China has been growing rapidly in recent years.
The remaining immigrants come from dozens of other countries across Latin America, Asia, Africa, Europe, and other regions.
Also read about: Australia’s Social Media Ban for Kids Sparks Global Push
Understanding the Demographics
Age and Life Stage
One of the most important facts about immigrants is that they tend to be younger and of working age compared to people born in the United States. This has major implications for the economy and programs like Social Security.
Age Distribution: Immigrants vs US-Born Americans
| Age Group | Immigrants | US-Born |
| Children (0-15) | 4.9% | 21.4% |
| Working Age (16-64) | 77.1% | 60.9% |
| Seniors (65+) | 18.0% | 17.7% |
As you can see, more than three-quarters (77.1%) of immigrants are working age, compared to just 60.9% of US-born Americans.
This means immigrants are more likely to be working, paying taxes, and contributing to the economy.
They’re less likely to be children requiring education services, though the senior population is similar between both groups.
Immigrant Children and Families
While only 4.9% of immigrants themselves are children, many US-born children have immigrant parents. In fact:
- 2.9 million immigrant children live in the United States
- 22.9 million US-born children live with at least one immigrant parent
- 8.0% of all US-born residents live with at least one immigrant parent
This shows how deeply woven immigrants are into the fabric of American families. Millions of American citizens have direct family connections to immigration, making it a personal issue for many families across the country.
Economic Contributions: How Immigrants Strengthen America’s Economy
Taxes and Spending Power
Immigrants are major economic contributors. They pay taxes, earn incomes, and spend money in their communities just like everyone else—but the numbers are massive when you add them all up.
Immigrant Economic Impact (2023)
| Category | Amount |
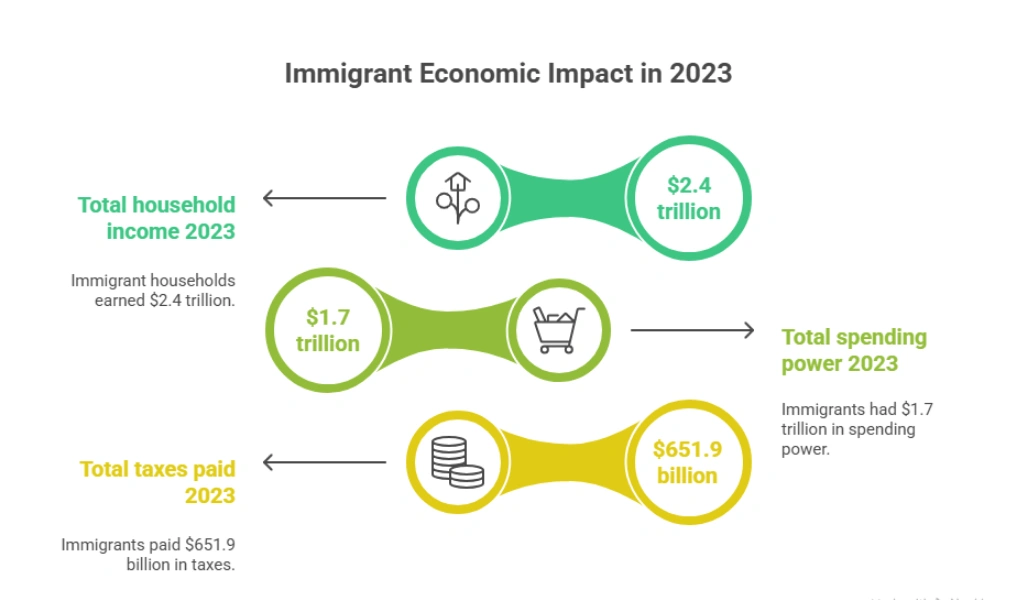
| Total household income | $2.4 trillion |
| Total spending power | $1.7 trillion |
| Federal taxes paid | $419.8 billion |
| State and local taxes paid | $232.1 billion |
| Total taxes paid | $651.9 billion |
Immigrants paid nearly $652 billion in taxes in 2023 alone. To put that in perspective, that’s more than the entire GDP of many countries.
This money helps fund schools, roads, police and fire departments, national defense, and all the other public services Americans depend on.
Immigrants also contribute specifically to programs that support older Americans:
- $215.8 billion to Social Security
- $58.7 billion to Medicare
These contributions are especially important as America’s population ages and more baby boomers retire. Younger immigrant workers help keep these programs financially stable by paying into the system.
Entrepreneurship and Job Creation
Immigrants don’t just work for others—they create jobs by starting their own businesses. In fact, immigrants start businesses at higher rates than US-born Americans.
Immigrant Entrepreneurship Facts
- 23.6% of all entrepreneurs in America are immigrants (even though immigrants are only 14.3% of the population)
- 3.9 million immigrant entrepreneurs operate businesses across the country
- These businesses generate $116.2 billion in business income
- 230 Fortune 500 companies were founded by immigrants or their children
You probably interact with immigrant-founded companies regularly, even if you don’t realize it.
Some of America’s most successful companies—including Google, eBay, Yahoo, Tesla, and many others—were founded by immigrants or the children of immigrants. These companies employ millions of Americans and generate billions in economic activity.
Immigrants in the Workforce
Overall Labor Force Participation
Immigrants make up a significant portion of America’s workforce. In 2023:
- 30.7 million immigrant workers were in the US labor force
- Immigrants represent 17.7% of all workers
- This is higher than their population share (14.3%), showing they’re more likely to be working
Education Levels
Immigrants have diverse educational backgrounds. Some are highly educated with advanced degrees, while others have less formal education. This allows them to fill jobs across the skill spectrum.
Educational Attainment: Immigrants vs US-Born (Age 25+)
| Education Level | Immigrants | US-Born |
| Less than high school | 24.7% | 7.0% |
| High school & some college | 40.2% | 56.5% |
| Bachelor’s degree | 19.2% | 22.4% |
| Graduate degree | 15.9% | 14.1% |
Notice that immigrants are more likely than US-born Americans to have either less than a high school education OR a graduate degree.
This “barbell” distribution means immigrants fill critical gaps at both ends of the labor market—from agricultural workers to doctors and engineers.
Industries Where Immigrants Work
Immigrants work in every industry, but they’re especially important in certain sectors:
Industries with Highest Share of Immigrant Workers
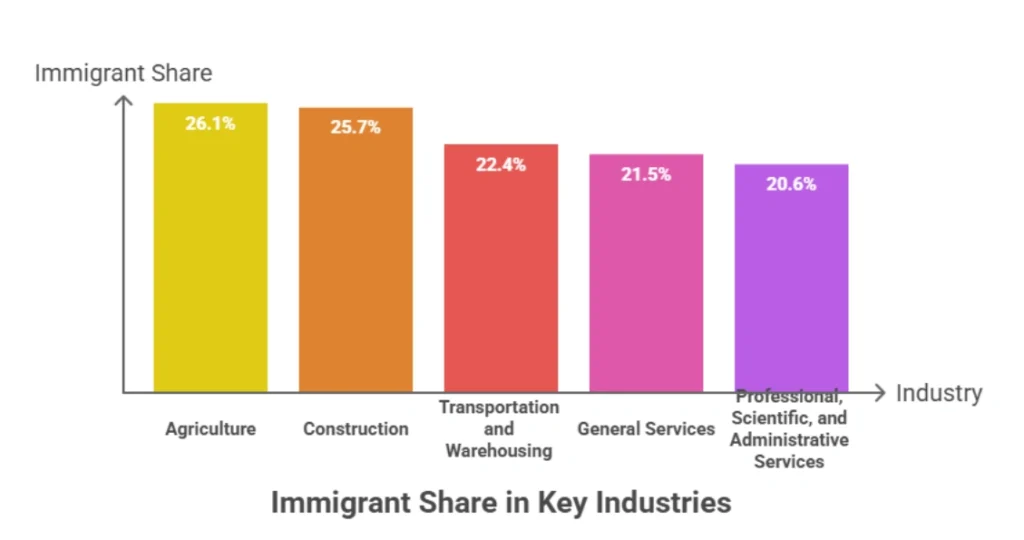
- Agriculture – 26.1% of workers are immigrants
- Construction – 25.7% of workers are immigrants
- Transportation and Warehousing – 22.4% of workers are immigrants
- General Services – 21.5% of workers are immigrants
- Professional, Scientific, and Administrative Services – 20.6% of workers are immigrants
These percentages are all higher than the immigrant share of the overall population (14.3%), showing that immigrants play an outsized role in keeping these industries running.
Specific Occupations
Some specific jobs rely very heavily on immigrant workers:
Top 5 Occupations by Immigrant Share
| Rank | Occupation | % Immigrant Workers |
| #1 | Manicurists and pedicurists | 74.1% |
| #2 | Agricultural graders and sorters | 64.7% |
| #3 | Drywall and ceiling tile installers | 61.0% |
| #4 | Plasterers and stucco masons | 57.7% |
| #5 | Taxi drivers | 56.5% |
These occupations would face severe worker shortages without immigrants. Imagine trying to find enough workers for these jobs if three-quarters of them suddenly disappeared—many businesses would struggle or close.
Immigrants in Critical Sectors
Science, Technology, Engineering, and Math (STEM)
America’s technology leadership depends heavily on immigrant workers. STEM jobs are some of the fastest-growing and highest-paying in the economy, and immigrants fill nearly a quarter of these positions.
- 23.6% of all STEM workers are immigrants
- This percentage is much higher than their population share, showing immigrants’ crucial role in keeping America competitive in technology and innovation
Many of the engineers, software developers, data scientists, and researchers working at America’s leading tech companies are immigrants.
Without them, companies like Google, Microsoft, Amazon, and countless smaller tech firms would struggle to find enough qualified workers.
Healthcare
As America’s population ages, the healthcare system needs more workers than ever. Immigrants help fill this critical need across all levels of healthcare.
Immigrant Healthcare Workers
- 15.9% of nurses are foreign-born
- 28.4% of home health aides are foreign-born
- Immigrants are twice as likely as US-born Americans to work as physicians and surgeons
- Immigrants are twice as likely to work as home health aides
Without immigrant healthcare workers, hospitals and nursing homes across America—especially in rural areas—would face severe staffing shortages. Many patients would struggle to access the care they need.
Housing and Community Development
Homeownership
Immigrants are active participants in America’s housing market, both as renters and homeowners.
Immigrant Housing Statistics
- 11.6 million immigrant homeowners across the United States
- 15.4% of recent homebuyers are foreign-born
- $6.6 trillion in housing wealth held by immigrant households
- $167.2 billion paid in rent annually by immigrant households
Immigrant homeownership has helped revitalize neighborhoods in many cities.
Research shows that immigrants often move into declining neighborhoods, invest in homes and businesses, and help turn these areas around.
This benefits everyone in the community, including US-born residents whose property values increase as neighborhoods improve.
International Students
Economic Impact
International students studying at US colleges and universities provide a major economic boost:
- 1.1 million international students at US colleges and universities
- $43.8 billion economic contribution to the US economy annually
- 378,175 US jobs supported by international student spending
These students pay tuition (often at full price without financial aid), rent apartments, buy food and supplies, and contribute to local economies around college towns and cities.
Research also shows that international students boost innovation and patent creation at universities, helping advance American science and technology.
Undocumented Immigrants: Facts and Contributions

Population Overview
The presence of undocumented immigrants is one of the most debated aspects of US immigration. Here are the key facts:
- 11.8 million undocumented immigrants live in the United States
- They represent 24.7% of all immigrants (about 1 in 4)
- They represent 3.5% of the total US population
- 89.4% are working age (16-64 years old)
Economic Contributions
Despite their legal status, undocumented immigrants contribute significantly to the economy:
Undocumented Immigrant Economic Impact
| Measure | Amount |
| Household income | $388.8 billion |
| Spending power | $299.0 billion |
| Federal taxes paid | $55.8 billion |
| State/local taxes paid | $33.9 billion |
| Total taxes paid | $89.8 billion |
Yes, undocumented immigrants pay nearly $90 billion in taxes annually, even though they can’t access most federal benefits like Social Security, Medicare, or food stamps.
Many pay into Social Security through payroll taxes but will never be able to collect benefits.
Workforce Participation
Undocumented immigrants make up 4.9% of the US workforce and are concentrated in certain industries:
Industries with Highest Share of Undocumented Workers
- Agriculture – 15.1% undocumented
- Construction – 14.1% undocumented
- Arts, Entertainment, Hospitality, Food Services – 7.6% undocumented
- General Services – 6.7% undocumented
- Wholesale Trade – 6.3% undocumented
These industries would face immediate labor crises if undocumented workers were suddenly removed.
Entrepreneurship
Even without legal status, undocumented immigrants start businesses:
- 1.1 million undocumented entrepreneurs operate businesses across America
- These businesses create jobs and economic activity in their communities
American Families Connected to Undocumented Immigrants
Millions of US citizens have undocumented family members:
- 9.1 million US citizens live with at least one undocumented family member
- 5.2 million US citizen children live with at least one undocumented family member
- 4.2 million US citizen children live with at least one undocumented parent
This means that immigration enforcement doesn’t just affect undocumented immigrants—it affects millions of American citizen children and families.
DACA Recipients: The Dreamers
Who Are DACA Recipients?
DACA (Deferred Action for Childhood Arrivals) protects young people who were brought to the US as children. Key facts:
- 1.13 million DACA-eligible residents in the United States
- 537,730 people with active DACA protection
- 834,877 total people granted DACA since the program began
- 96.9% employment rate among DACA-eligible people in the labor force
Economic Contributions
DACA recipients are highly productive members of society:
DACA-Eligible Population Economic Impact
- 76,500 DACA-eligible entrepreneurs
- $46.5 billion in household income
- $35.0 billion in spending power
- $11.5 billion in total taxes paid ($6.6B federal, $4.9B state/local)
Removing DACA protections would hurt local economies, employers, schools, and communities that depend on these young people as workers, business owners, and consumers.
Refugees: Americans by Choice

Population and Status
Refugees are people who fled persecution in their home countries and were resettled in the United States through official programs:
- 2.2 million likely refugees currently living in the US
- 100,034 refugees resettled in the last fiscal year
- 85.5% are naturalized US citizens (showing long-term integration)
Top Countries of Origin for Recent Refugees
| Country | Share of Recent Refugees |
| Democratic Republic of the Congo | 19.9% |
| Afghanistan | 14.7% |
| Venezuela | 12.9% |
| Syria | 11.3% |
| Myanmar | 7.3% |
Economic Contributions
Refugees quickly become productive members of American society:
Refugee Economic Impact
- 96.5% employment rate (higher than the US average!)
- 178,100 refugee entrepreneurs
- $6.0 billion in business income from refugee-owned businesses
- $115.0 billion in household income
- $83.8 billion in spending power
- $31.2 billion in total taxes paid
Rather than being a drain on communities, refugees sustain and strengthen their new hometowns through high employment rates, entrepreneurship, and economic contributions.
Temporary Protected Status (TPS) Holders
Who Has TPS?
Temporary Protected Status is granted to people from countries experiencing war, natural disasters, or other crises that make return unsafe:
- 696,900 TPS holders in the United States
- 87.9% are working age
- 95.5% employment rate
Economic Impact
TPS holders are highly economically active:
- $22.1 billion in household income
- $16.9 billion in spending power
- $5.2 billion in total taxes paid
Forcing TPS holders to leave would disrupt local economies and put these individuals in danger in their home countries.
Political Power and Civic Engagement
Naturalization and Voting
As immigrants naturalize and gain citizenship, they become an increasingly important political force:
- 23.7 million naturalized US citizens who are immigrants
- 22.8 million immigrants eligible to vote
- 7.4 million additional immigrants eligible for naturalization
As these numbers grow, immigrant voters are increasingly capable of deciding elections in many states and localities. This gives immigrant communities more voice in shaping policies that affect them and their neighbors.
Why These Numbers Matter
Economic Necessity
America faces significant demographic challenges. The baby boom generation is retiring, and birth rates have fallen below replacement level.
Without immigration, the US workforce would shrink, threatening economic growth and straining programs like Social Security and Medicare.
Immigrants help solve this problem by being concentrated in working-age groups, paying taxes that support retirees, filling job openings in critical industries, and starting businesses that create jobs for everyone.
Labor Market Realities
Many industries simply cannot function without immigrant workers. From agriculture to construction to healthcare to technology, immigrants fill jobs that would otherwise go unfilled.
While some worry about immigrants taking jobs, the reality is more complex—immigrants often take jobs that US-born workers don’t want or aren’t available to fill, and their economic activity creates additional jobs for everyone.
Innovation and Competitiveness
America’s global leadership in technology and innovation depends partly on attracting talented immigrants.
With 23.6% of STEM workers being immigrants and major tech companies founded by immigrants, restricting immigration could harm America’s competitive position relative to other countries.
FAQs About US Immigration Statistics
1. How many immigrants live in the US?
As of 2023, 47.8 million immigrants live in the United States, making up 14.3% of the total population, with immigrants representing nearly 1 in 7 people.
2. Where do most immigrants in the US come from?
The largest groups of immigrants in the US come from Mexico (22.8%), India (6.1%), China (4.6%), Philippines (4.3%), and El Salvador (3.1%), with immigration from Asian countries growing rapidly.
3. How do immigrants contribute to the US economy?
Immigrants contribute significantly, with $2.4 trillion in household income, $651.9 billion in taxes paid, and key contributions to industries like healthcare, technology, and agriculture.
4. What industries rely most on immigrant workers?
Immigrants make up large portions of the workforce in industries such as agriculture (26.1%), construction (25.7%), and transportation (22.4%), playing a crucial role in keeping these sectors running.
5. What is the impact of undocumented immigrants in the US?
There are 11.8 million undocumented immigrants in the US, contributing $89.8 billion in taxes annually, and working primarily in industries like agriculture, construction, and services.
Also Read:
Conclusion: Understanding Immigration’s Role in America
The statistics paint a clear picture: immigrants are deeply integrated into American society and make massive contributions to the economy.
They pay hundreds of billions in taxes, start businesses at high rates, fill critical workforce gaps, and strengthen communities across the country.
At the same time, immigration is complex. The presence of nearly 12 million undocumented immigrants poses legal and political challenges.
Debates continue about how many immigrants to admit, what skills they should have, and how to balance economic needs with security concerns.
What’s undeniable from the data is that immigrants are not just visitors or temporary workers—they are neighbors, coworkers, business owners, taxpayers, parents, and increasingly, voters.
Their contributions span every sector of the economy and every region of the country.
Understanding these facts and statistics helps us have more informed conversations about immigration policy.
Whether you support more immigration or less, tighter enforcement or pathways to citizenship, these numbers provide the foundation for understanding what immigration really means for America today and in the future.
The United States has always been shaped by immigrants, and the data shows that pattern continues today.
As America faces demographic and economic challenges in the coming decades, how the country approaches immigration will be one of the most important factors determining its future prosperity and global position.
Source: Wikipedia, American Immigration Council